Update

The PQ might have more voters, but they’re increasingly volatile

My God, was it time or what?!? As Bryan Breguet put it on Twitter while awaiting the Léger results:

Juste une observation générale mais quand il y a davantage de personnes/sites faisant des projections que de firmes offrant des sondages, c’est pas vraiment normal1.

Thank goodness, this morning, Léger released the full report of its latest poll, conducted between 7 and 10 September!

I’m waiting to get my hands on the Mainstreet report for the poll conducted 5 to 7 September to update the voting intentions chart since I need the figures before allocating the undecided. At the moment, I only have the Le Soleil article, which only gives the results after distribution.

We can nevertheless update our voter volatility charts:

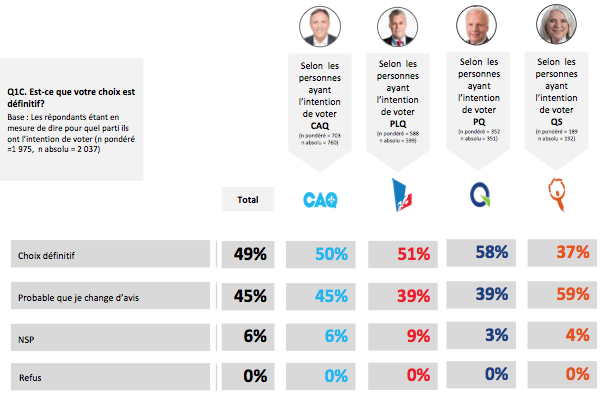
Voter volatility is fairly stable. The share of voters whose choice is definitive amongst those who have made a choice has gone from 56% to 58% in the span of a fortnight.

The results broken down by party are more revealing:

Voting intentions for the Parti Québécois seem to be going up, with a two-percentage-point increase over the last two weeks (19% to 21% once the undecided are allocated). However, the PQ has slipped from the party with the least wavering electorate to the second to last amongst the Big Four.

Indeed, in the poll that ran until 28 August, 64% of people who intended to vote for the PQ considered that their choice was definitive. In yesterday’s poll, that proportion was down to 54%. Jean-François Lisée’s party is the only to have seen its voters’ volatility increase!

Do these results mean that people who are moving back and forth between the PQ and the CAQ are now saying that they will vote PQ, but that they might still change their minds?

To figure that out, we’ll have to dig into answers to the question related to alternative choices… to be continued!

Source data

You can access the spreadsheet from which the charts were generated on Google Spreadsheets.

Notes

Reaction

Volatility and likelihood of voting

In their June podcast, Qc125’s Philippe J. Fournier and L’Actualité’s Alec Castonguay were talking about Laurier-Dorion, my riding (in which Martin was in charge of phone banking during the 2012 elections). This Montreal riding runs south of the Metropolitan between L’Acadie and Papineau. It brings together two very different neighbourhoods on either side of a train track: Parc-Extension to the west and Villeray to the east.

Parc-Ex is the place to go feast on butter chicken (I usually go for lamb korma though) and watch cricket being played by people much more experienced than in Seducing Dr. Lewis.

In Villeray, you’re asked in coffee shops whether you’d like cow’s milk, almond milk or soy milk, and butchers work directly with local farmers to source their meat. In short, it’s a lot like the Plateau in a lot of people’s minds. (The Plateau is very different from Villeray, but I’ll keep my Montreal-focused parochial feuds for those times when I’m visiting with cousins.)

So, as the guys over at the L’Actualité politics podcast were saying, Laurier-Dorion is a riding that Quebec Solidaire could snatch from the Liberals if enough people in Parc-Ex stay home. Up to that point, I’m fully onboard. Where things get dicey is when they contrasted the possible lack of enthusiasm in Parc-Ex’s non-French-speaking electorate —which is solidly in the QLP column— with the supposedly inevitable enthusiasm of QS voters in Villeray:

Les partisans de Québec solidaire, là, ils ne restent pas à la maison. Quand t’es Québec solidaire, dans’ vie, la seule chose qui te reste, c’est d’aller voter. Ok? Parce que tu sais que tu vas pas gagner. Alors ils vont aller voter.1

That might be the impression QS social media fervour gives, but the Quebec Solidaire electorate is in fact the most volatile amongst parties that hold seats in the National Assembly. And I have the numbers to prove it!

Source: “La politique provinciale au Québec.” Léger, 18 August 2018, p. 7.

Quebec Solidaire is the only party at the National Assembly for which more than half the people intending to vote for it could change their minds. It’s almost always been like that since Léger started breaking down results for Quebec Solidaire voters back in 2012.

Taking a look in the rearview mirror

In the ten Léger polls for which we have QS data, it only happened three times that Coalition Avenir Québec voters professed to be less sure of which party they’d be casting their votes for than those of QS (31 July 2012, 31 August 2012 and 13 March 2014). Incidentally, the Parti Québécois electorate is generally the steadiest.

So they’re gonna vote?

In addition to displaying greater volatility, Quebec Solidaire voters are less inclined to going to the polls than PQ and CAQ voters. It resembles the QLP electorate in that respect.

Source: “La politique provinciale au Québec.” Léger, 18 August 2018, p. 39.

Four out of five people who said they intended to vote for Quebec Solidaire are “certain” of going to vote, but one out of five did say it was only “probable.” Amongst people intending to vote for the Part Québécois, it’s just one out of ten.

Therefore, the people who tell polling firms that they intend to vote for Quebec Solidaire are not a bunch of democracy warriors perpetually ready for combat. These are ordinary people who are sympathetic either to the party’s discourse or to its approach, but not quite enough in many cases to make it to the polls or to actually change sides.

Source data

You can access the spreadsheet from which the chart was generated on Google Spreadsheets.

Notes

Reaction

Is there greater voter volatility than usual?

A headline from the Journal de Montréal the other Saturday read “Du jamais-vu: 45% des électeurs peuvent encore changer d’idée”.1

Du jamais-vu: 45% des électeurs peuvent encore changer d'idée
Source: Alexandre Beaupré, Facebook

So are things that different this time around? I checked in polls from the last ten years. While 45% is indeed a high mark, there have been more voters uncertain of how they will vote before:

First of all, the share of respondents who say that they might change their minds (red bars) is not the most meaningful measure. Indeed, you’d be hard pressed to explain the difference between that answer (in red) and “I don’t know” (in yellow) given that the question being asked is “Have you made a definitive choice?” If 45% seems like a huge proportion, it is still less than when you add up the 24% who said “I don’t know” last May and the 25% who said “I might change my mind”.

The most meaningful measure is the share of voters who say they’ve made up their minds and their choice is definitive. As you can see from the blue bars increasing in height during a given year and then dropping after the election, that proportion always increases as the campaign gets closer and as it progresses.

The other time it happened…

Over the last ten years, in polls conducted by Léger, it previously happened only once that the share of people who had made up their minds dropped below 50%: in January 2012. At that point in time, however, the campaign was still months away. The Liberals had won a majority government in December 2008, so in January 2012, it still had a full year left to its term.

Furthermore, in January 2012, the students had started mobilizing, but their organizing remained under the radar of the mainstream media: the population of Quebec was yet to be polarized by the issue.

So that 45% of voters that could still change their minds is not unheard of, but in the last decade it’s never happened this close to an election.

Source data

You can access the spreadsheet from which the chart was generated on Google Spreadsheets.

Notes