by Marie Léger-St-Jean
Despite visual representations that clearly show overlapping results, some people do still manage to ignore statistical equality:
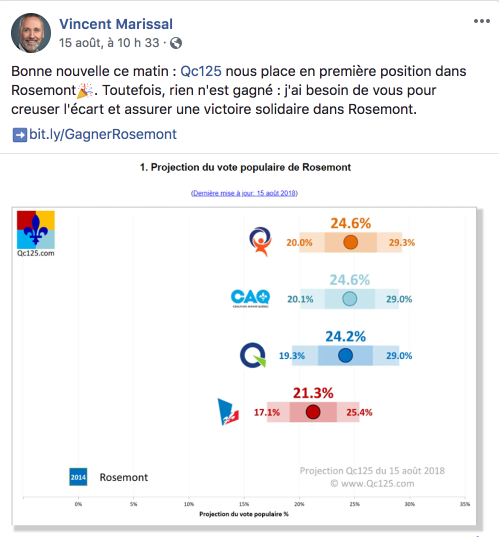
Source: Vincent Marissal, Facebook.
The Qc125 and Too Close To Call models are made up of a set of rules to translate the overall data into riding-level data. However, models are also made up simulations.
Instead of simply inputting polling numbers into a spreadsheet, Bryan and Philippe get a computer to randomly generate distributions that fit the polls’ margins of error. That’s how they get their confidence intervals and each party’s odds of winning.
Undecided and discrete voters
So that was statistical uncertainty. What about human uncertainty? Undecided voters who just aren’t thinking about the election or who despair when they look at what their options are? Models don’t emphasize these because they’re more concerned with the issue that has been nagging at pollsters since the very beginning: how to allocate undecided voters.
The allocation of undecided voters is meant to predict the outcome of an election. Indeed, you can’t cast your vote for “I dunno”. On Election Day, the people who’ve responded this way to pollsters will cast their votes for one party or the other, will go to the polls to rescind their votes or will just stay home.
By allocating undecided voters to specific parties, pollsters and projection models are trying to figure out in which category undecided respondents will fall into to predict as accurately as possible the outcome of the election.