Let’s start with a bit of a rant (now that I’ve achieved expert-status):1 projections are not polls! (If you already know, but want to understand how projections work, you can skip right ahead to the relevant section of the post.)

Martin’s the one who circled the paragraph in his local newspaper:
Indeed, the most recent polls place incumbent Jean-François Lisée almost equal to challenger Vincent Marissal, a new Quebec Solidaire recruit.
“The most recent polls” on 4 September were saying that Jean-François Lisée was far behind François Legault and Philippe Couillard, only one placed it ahead of Vincent Marissal: an internal poll for the Parti Québécois, which hasn’t released the full report.
Yes, you heard right: the vast majority of polls are province-wide polls. The Parti Québec released internal polls for the ridings of Rosemont and Joliette, where the Jean-François Lisée/Véronique Hivon ticket is running. Mainstreet is starting to conduct polls in targeted ridings (including Rosemont) for its Baromètre Élections 2018, but they haven’t been released yet.
The journalist probably meant to say “the projections based on the most recent polls,” talking about Qc125 and Too Close To Call. (There’s a third model I hadn’t heard of until today: I introduce it further down.)
Dos and don’ts
A much worse example in my opinion was published last Saturday in the HuffPost:
Il y a quelques semaines, les sondages disponibles laissaient entrevoir une course à quatre dans Rosemont. La candidate de la CAQ Sonya Cormier récoltait 24% d’appuis, autant que MM. Lisée et Marissal, alors que la libérale Agata La Rosa suivait de près à 21%.
Depuis, le chef péquiste et le candidat solidaire se sont détachés quelque peu du lot, mais Mme Cormier estime qu’elle incarne une option intéressante.2
CAQ candidate Sonya Cormier has not “gathered” support, she was forecasted to have 24% support. Furthermore, the only shifts in public opinion that have been measured are province-wide since there haven’t been two local polls released for the same riding yet. Hence, you can’t say “the PQ leader and the QS candidate have put some distance between themselves and their opponents.” At the most, you could say the slight decrease in CAQ support province-wide is likely to impact its Rosemont candidate.
The CTV article linked to in the HuffPost article puts things more clearly. Indeed, it presents the three “race leaders” as situated in the same range. I would have however added “All three are projected to have” in the last paragraph:
The QC125.com projection shows Lisée has about the same amount of support as Quebec Solidaire candidate and former journalist Vincent Marissal, and the CAQ’s Sonya Cormier, the director of the Movement to end homelessness in Montreal (MMFIM).
All three have from 24.2 to 24.6 percent support, while Liberal candidate Agata La Rosa, a school commissioner with the Pointe de L’Ile school board, has 21.3 percent support.3
As I said in the interview that sealed my status as an expert (I hope you get just how hilarious I think it is):
Il y a beaucoup de gens qui pensent que les projections sont basées sur des sondages locaux. Non! Ce sont des sondages nationaux qui sont traduits en résultats locaux sur la base des résultats à la dernière élection, sur les changements démographiques du recensement, et d’autres informations si possible, comme Nate Silver aux États-Unis qui évalue le financement des candidats, la présence de scandales, l’avantage d’être un élu sortant qui se représente.4
How do projection models work?
The “Polling & Projection models” section in our Elections Primer gives an overview of the difference between the two.
In this post, I would like to peer into the black box of projection models thanks to the new kid on the block. Produced by academics, this new model is the result of a collaboration between McGill professor Benjamin Forest and a Université de Montréal graduate, Eric Guntermann, now a post-doc at the University of California, Berkeley. A friend of mine working in communications at McGill told me about it.
The model has the definitive advantage of being completely transparent about its methodology in a webpage only in French. To give you a sense of how projection models work, I’ll extract each step of it.
Choices, choices, choices…
All models use polling to assess how results will change according to previous elections. Here are therefore the four questions each model needs to answer:
- How do the 2014 results translate onto the 2017 map?
- How has support for each party changed since the last election?
- How does that translate into individual ridings?
- What does that mean in terms of the number of seats each party wins?
Building a model means deciding between lots of different more or less sophisticated ways of answering these questions. Since Benjamin Forest is a geographer, he went through a lot of trouble to factor in electoral boundary changes: that’s his expertise!
To answer the third question, however, the Guntermann/Forest model only brings into play province-wide polls. It doesn’t take into account demographic changes reflected in the last census, the people who are running, or local polls.
Let’s take a closer look.
How do the 2014 results translate onto the 2017 map?
Electoral boundaries changed last year. The 2012 and 2014 elections used the 2011 map; this year, we’re using the 2017 map for the first time. It removed one riding each in Montreal and in Mauricie to add two on Montreal’s north shore.
The 2014 results must therefore be redistributed on the new map. Here’s how the Guntermann/Forest model does it. If you can read French, I encourage you to read their explanations: they’re clearly illustrated with a table and a map, which I’ve reproduced.
Mapping 2014 polling subdivisions onto 2017 riding boundaries
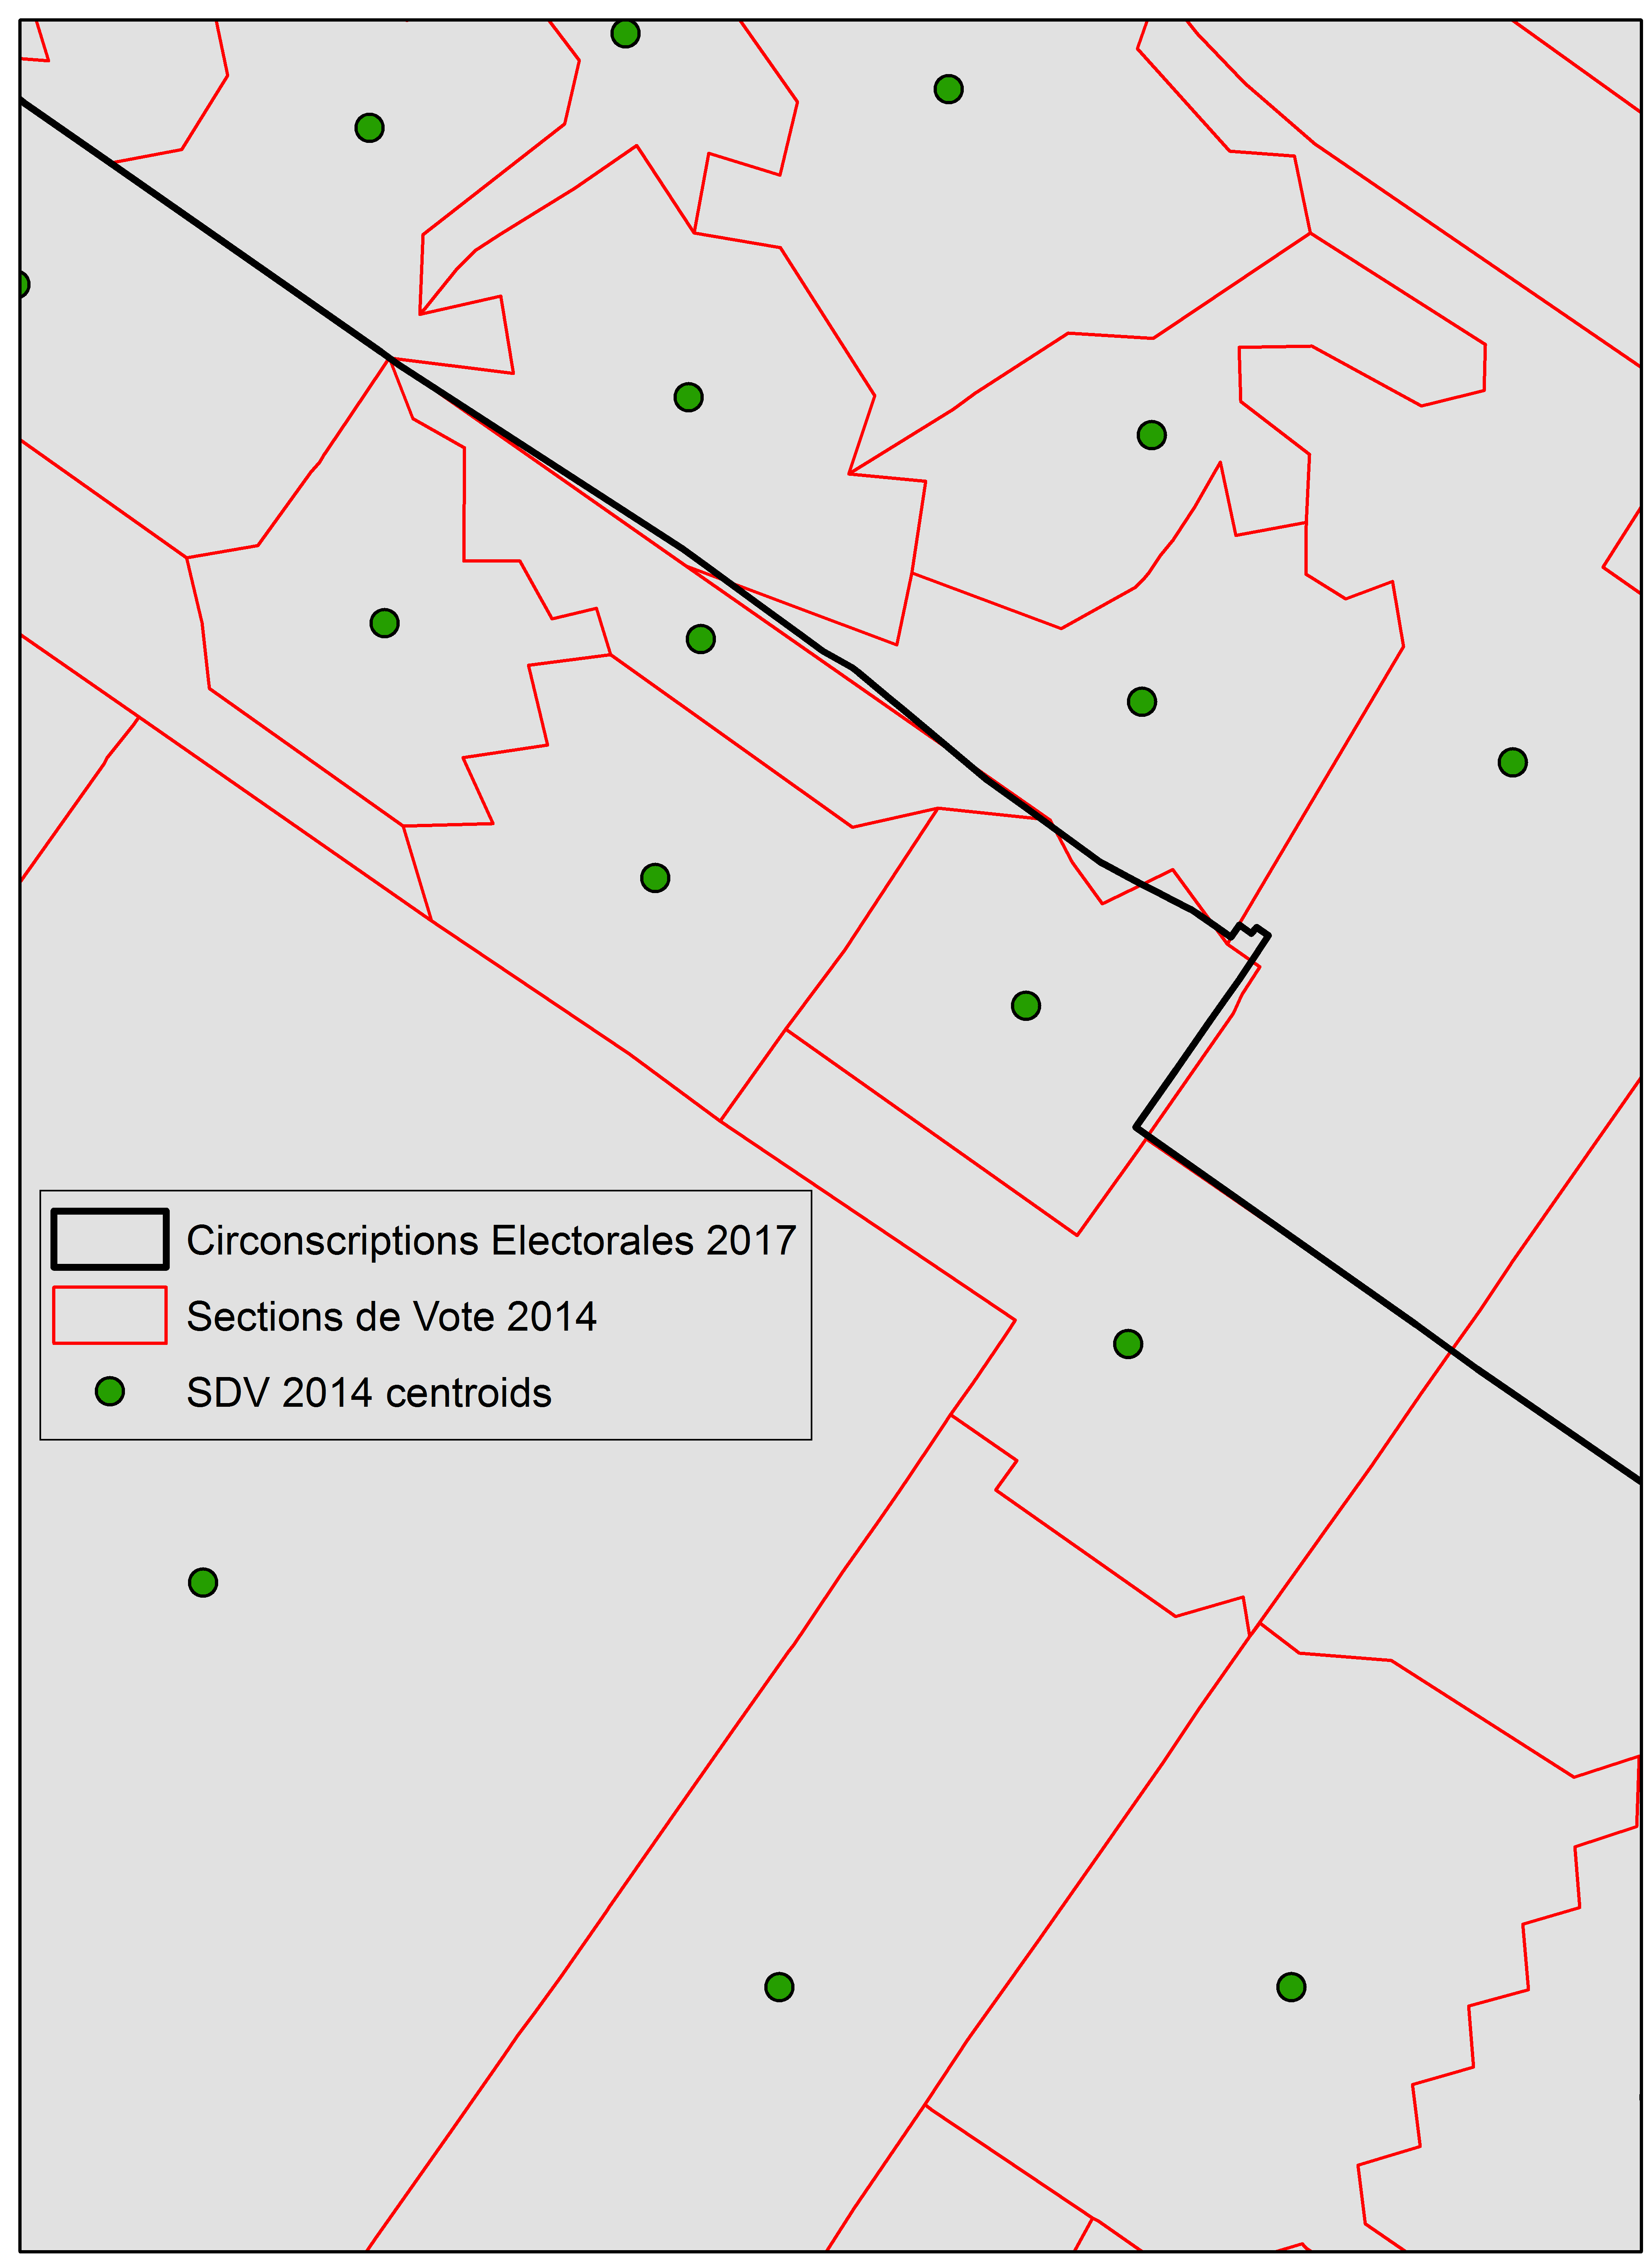
Using a geographic information system (GIS), Guntermann and Forest found in which 2017 riding each 2014 polling subdivision stood.
It’s easy enough when a polling subdivision is fully nested into a riding, but it gets dicier when it straddles two ridings. Looking at the map opposite, you might think you could go over the entire map and sort them easily enough. However, that could take some time and it might not always be as self-evident.
To determine in which riding each polling subdivision fits most into, Guntermann and Forest used centroid allocation. They found the central point of these odd-shaped figures and established in which of the two ridings it was located.
Allocating votes that aren’t tied to a polling subdivision
The polling-subdivision results are only available for votes cast on election day. Results for early voting are compiled by advance polling station, each of which brings together no more than a dozen polling subdivisions.5
Results in a given riding for those who voted by mail, in a mobile polling station or in prison are not broken down.
Guntermann and Forest made two choices:
- ignoring advance polling stations as a higher-order polling subdivision;
- making the assumption that votes for a given party follow the same geographic distribution within the riding on election day as in other moments and/or ways of voting.
They therefore redistributed —for each party and in each riding— the early voting results, the mail-in ballots as well as the mobile-polling-station and prison voting results according to the geographic distribution of votes for that party on election day in each of the riding’s polling subdivisions.
They then added up in each polling subdivision this estimate and the votes the party got on election day.
How has support for each party changed since the last election?
Guntermann and Forest chose to use a single poll for their forecast: the most recent one. For their last forecast, they therefore used the Léger poll that was completed on 28 August.
Ils comparent donc à l’échelle nationale ce sondage aux résultats de 2014 en faisant pour chaque parti une simple division (pourcentage du parti au plus récent sondage national sur pourcentage obtenu par le parti en 2014).
They therefore compare, province-wide, that poll with 2014 results, simply dividing the party’s percentage in the most recent province-wide poll by the percentage it got in 2014.
They thus get five swing values since the last election, one for each party with a seat at the National Assembly and a fifth for all other parties taken together.
How does that translate into individual ridings?
We can expect models will vary most widely in the way they answer this question.
Guntermann and Forest run 1,000 simulations.
In the parameters of their simulations, they start with the following hypothesis: each party’s result in 2018 in each riding will depend on a uniform swing for this party province-wide, calculated above. From this hypothesis, they generate random swings for each party in each riding. Then, they multiply the 2014 result of that party in that riding by the random swing in the given simulation.
Finally, they provide riding-level results as the odds for each party to win the seat, i.e. the number of simulations in which that party got the highest share of the vote, divided by 1,000 (the total number of simulations).
They also provided a second table with each party’s vote share from the median simulation in each riding.
What does that mean in terms of the number of seats each party wins?
To determine which party is elected into office and if it will lead a majority or a minority government, you need to tally up the results for each riding.
Each simulation functions as the result of a hypothetical election: with vote shares for each party with a seat at the National Assembly, we can tell which one wins each riding and, ultimately, how many seats each of them win in this hypothetical election.
We therefore have a set of 1,000 numbers of seats for each of these four parties. The model gives for each party the median of these 1,000 results, i.e. the average of the 500th and 501st results when ordered from lowest to highest (or the other way around, it’ll come out the same).
Finally, the model renders uncertainty by calculating a 95% confidence interval. In other words, the 25 simulations with the lowest number of seats for a given party and the 25 simulations with the most seats are thrown out.
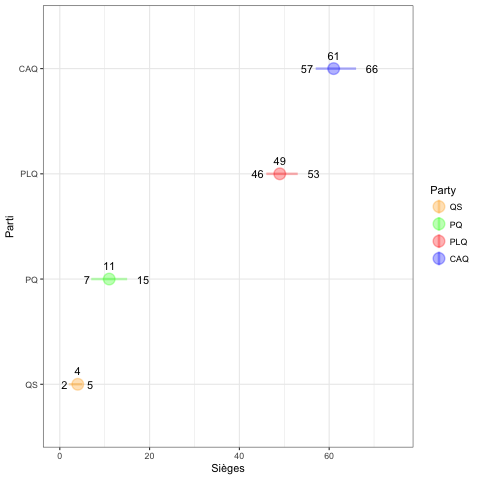
For their last projection, dated 2 September, we get:
We’ll look into how Qc125 and Too Close To Call navigate their choices next time.
Notes
- Lévesque, Catherine. “Peut-on se fier aux sondages politiques? @MatGalarneau fait le tour de la question avec des experts [Can we trust polls? @MatGalarneau addressed the issue with experts] https://quebec.huffingtonpost.ca/2018/09/05/fiabilite-sondages-politiques_a_23516940/.” Tweet. @CathLvesque, 5 September 2018.
- A few weeks ago, the available polls suggested there might be a four-way race in Rosemont. CAQ candidate Sonya Cormier gathered 24% support, as much as Messrs. Lisée and Marissal, while Liberal Agata La Rosa was right on their heels with 21%.
Since, the PQ leader and the QS candidate have put some distance between themselves and their opponents, but Ms. Cormier contends offers an interesting option.
Robichaud, Olivier. “Élections: le bleu péquiste vire au orange solidaire à Montréal.” HuffPost Québec, 1 September 2018.
- “Parti Quebecois leader Jean-Francois Lisée treasuring underdog status.” CTV Montreal News, 15 August 2018.
- A lot of people think projection models are based on local polling. They’re not! They translate province-wide polls into local results based on previous-election results, demographic changes reflected in the census, and other data when possible. In the US, Nate Silver factors in candidates’ fundraising, scandals, and incumbency.
Galarneau, Mathieu. “Peut-on se fier aux sondages politiques?.” HuffPost Québec, 5 September 2018.
- The key to match polling subdivisions and advance polling stations is not provided in the same file as the results, however.