by Marie Léger-St-Jean
Polling & Projection models
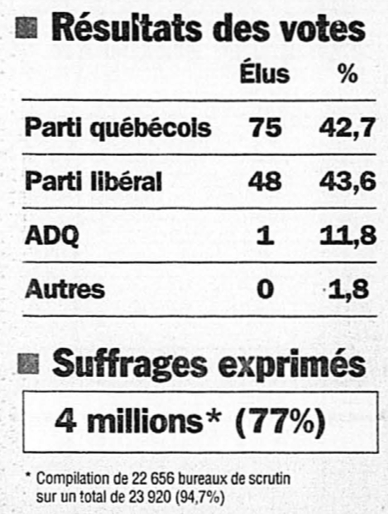
Twenty years ago, in 1998, Lucien Bouchard’s Parti Québécois collected less votes than Jean Charest’s Quebec Liberal Party, but won the election handily with 76 seats, leaving only 48 to the PQ.
How the hell did that happen?! It’s all because we don’t use a proportional voting system, neither in Quebec nor in Canada: we’ve inherited the British first-past-the-post system. The share of votes cast for a given party overall is therefore very different from the share of seats it ultimately wins.
Shockingly perhaps, you couldn’t even tell there was such a discrepancy on the front page of Devoir the next morning:
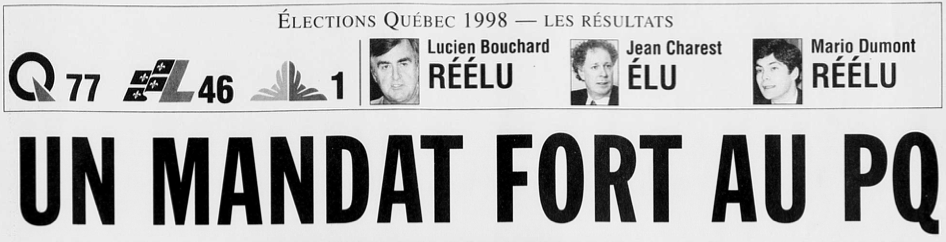
(Judging by the results splashed on their front pages, La Presse and Le Devoir weren’t operating on the same deadlines.)
Distribution of vote shares, polling, and projection models
Polling measures voter intentions in an attempt to predict the popular vote. Since our voting system isn’t proportional, polls, like the popular vote, do not directly translate into percentage of seats for each party at the National Assembly.
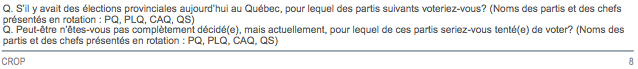
That’s why pollsters have long broken down voting intentions by voters’ first language (French-speakers vs. non-French-speakers or francophones vs. anglophones vs. allophones).
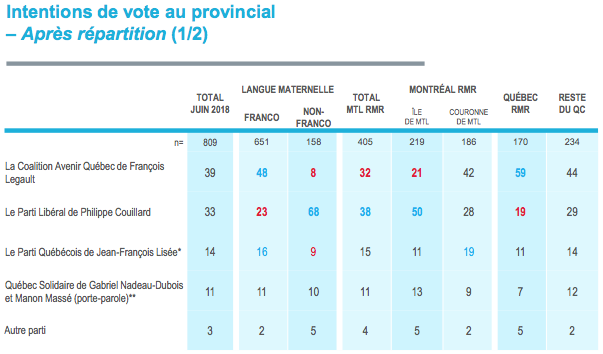
Because non-French-speaking voters are tightly clustered in certain geographic areas (in the West Island, the Outaouais, and the Eastern Townships), their vote doesn’t factor in as much as the francophone vote in the overall results.
Source: Le Devoir. 16 November 1998, p. A1. BAnQ numérique.
Indeed, there’s not difference between winning a seat with 90% of the vote in a given riding or winning it with just 35% of the vote. All that’s needed is to get more votes than the candidate that gets in second (hence the name “first past the post”).
So that’s what projection models are meant for: “translating” overall voting intentions into riding-level voting intentions in order to calculate how many seats each party will win.
Projection models
In recent years, people have been building projection models to translate voter intentions —as expressed in polls— into numbers of seats.
Ten years ago, Éric Grenier launched his projection site ThreeHundredEight.com, emulating American projection guru Nate Silver’s FiveThirtyEight. Éric has since become a full-time CBC employee and closed down his site.
![]()
![]() However, two other guys have since joined in the fun and are offering their own projection models: Bryan Breguet at Too Close To Call, founded in 2010, and Philippe J. Fournier, who created Qc125 in 2017.
However, two other guys have since joined in the fun and are offering their own projection models: Bryan Breguet at Too Close To Call, founded in 2010, and Philippe J. Fournier, who created Qc125 in 2017.
All of Bryan’s projections provide four data points for each party: predicted share of the popular vote, predicted number of seats, the confidence interval of seats a party wins in his simulations and a party’s odds of winning.
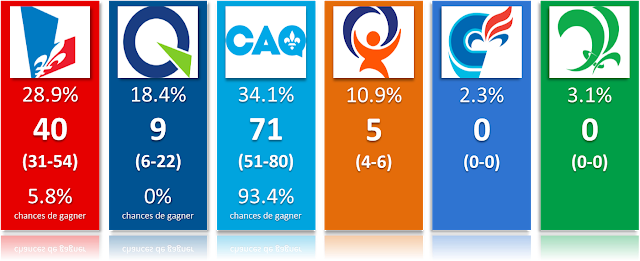
Philippe provides the same information using data visualizations (charts and a schematic representation of National Assembly seats). He provides confidence intervals for both the popular vote and seat projections.
Projection models can therefore account for the inherent uncertainty of polling. It’s a crucial aspect that Nate Silver seeks to educate his readers and listeners about in the context of American elections. Projection models aggregate (bring together) various pollsters, give greater weight to those with larger sample sizes, and take into account their margins of error.
Polling
Polls measure voting intentions. That means “if the election was held today, I’m pretty sure I’d vote for party X’s candidate”.
It’s just an intention, it’s not how people actually cast their votes. They can change their minds, end up not voting… or just lie to the pollster!
Pollsters try to randomly sample the entire population. It used to be that everyone had a landline and nearly everybody’s phone number was in the phone book (yes, kids, there was a life before cellphones). Those were much simpler times for pollsters.
In recent years, pollsters have started adapting to behavioural changes in the way people communicate. Pollsters can “buy” cellphone numbers to increase the share of the population they can reach over the phone.
Pollsters have also developed new methods using web panels. These samples are not randomly selected, but they are weighted using census data to represent the actual share of each demographic group within the wider Quebec population.
Uncertainty
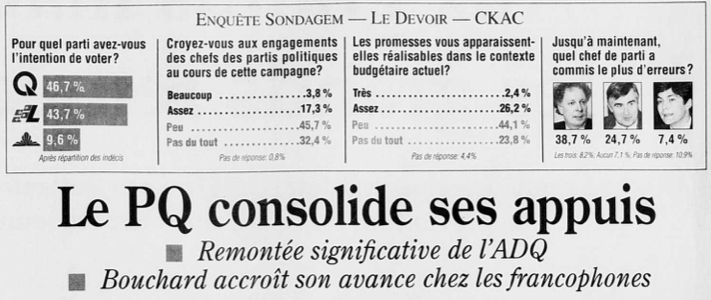
Despite visual representations that clearly show overlapping results, some people do still manage to ignore statistical equality:
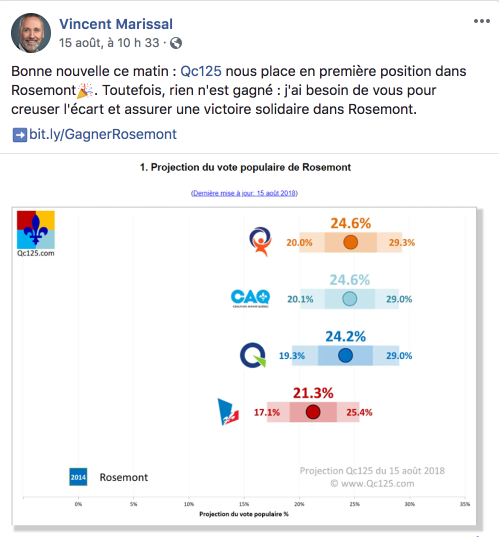
Source: Vincent Marissal, Facebook.
The Qc125 and Too Close To Call models are made up of a set of rules to translate the overall data into riding-level data. However, models are also made up simulations.
Instead of simply inputting polling numbers into a spreadsheet, Bryan and Philippe get a computer to randomly generate distributions that fit the polls’ margins of error. That’s how they get their confidence intervals and each party’s odds of winning.
Undecided and discrete voters
So that was statistical uncertainty. What about human uncertainty? Undecided voters who just aren’t thinking about the election or who despair when they look at what their options are? Models don’t emphasize these because they’re more concerned with the issue that has been nagging at pollsters since the very beginning: how to allocate undecided voters.
The allocation of undecided voters is meant to predict the outcome of an election. Indeed, you can’t cast your vote for “I dunno”. On Election Day, the people who’ve responded this way to pollsters will cast their votes for one party or the other, will go to the polls to rescind their votes or will just stay home.
By allocating undecided voters to specific parties, pollsters and projection models are trying to figure out in which category undecided respondents will fall into to predict as accurately as possible the outcome of the election.